In fact, Figure 1 shows the changes in the real and inflation components of nominal 5-, 10-, and 30-year yields for the U.S., the eurozone, and the United Kingdom over the past two weeks. As can be seen, part of the increase in real yields has come at the expense of inflation-adjusted prices in the U.S.
This is where one can make the first counterargument. This pattern of higher real yields and lower break-even inflation generally reflects the market’s perception of a tightening of monetary policy, something that is likely too early in the cycle for many central banks to consider (in fact, the ECB explicitly highlighted real yields as something to monitor, and the Fed chair himself delivered a fairly accommodative message during his testimony before the U.S. Congress this week)
Although the recent rise in real yields has not been large enough to prompt a reversal by central banks, one might assume that there are levels beyond which they will do so.
We have argued that a gradual rise in interest rates was to be expected, given the recovery first in inflation expectations and, more recently, in economic growth, as the vaccination process has progressed, but not the speed at which levels were reached that could be considered closer to fair value by the end of 2021. Ultimately, it is the speed of the movement rather than the trajectory that is stressing the market.
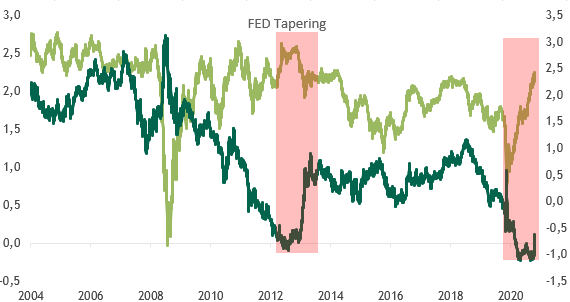
When the Fed signaled a return to normalcy in 2013 (that is, four years after the financial crisis), inflation expectations were closer to 2.5% and had already been stable around 2.0% for some time. Today, those expectations barely exceed 2.0%, especially considering that the current target is an average inflation rate of 2.0%, which implies greater tolerance for some degree of inflationary persistence. (See Chart No. 2)
Furthermore, the “taper tantrum” of 2013 was triggered by an explicit announcement from the Fed that it would begin to wind down the stimulus measures implemented after the financial crisis (slowing asset purchases in the initial phase), and we see none of that today. While it is true that the conditions for a reflationary process are being created, given the massive monetary and fiscal stimulus, it is also true that we are in a fairly early stage of economic recovery that is not without risks.
Chart No. 1: Breakdown of the nominal yield over the past two weeks; in basis points

Chart No. 2: Real and Breakeven Inflation Rates for 10-Year U.S. Treasuries