The release of U.S. CPI data for May delivered another upward surprise in inflation. Month-over-month CPI inflation was 0.6% in May, down from 0.8% in April, but enough to push annual CPI inflation to 5.0% from 4.2% in April. This is the highest annual inflation rate recorded since 2008.
Core inflation, defined as “all categories except food and energy,” rose 0.7% in May, down from 0.9% in April, but pushed annual core inflation up to 3.8% from 3.0% in April.
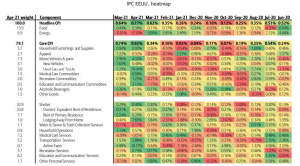
How much of this increase can still be explained by the notion of transience? Together, new and used cars contributed 37 basis points to the core CPI, accounting for half of this month’s increase (see table). The automotive sector continues to be affected by the global chip shortage, and it is difficult to predict how long this effect will last, as the situation will take time to resolve—even beyond 2021.
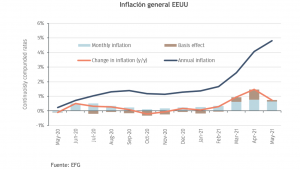
With monthly inflation at high levels in March, April, and May, it is clear that a new picture of inflation is emerging. Annual inflation rises if the observations being dropped from the calculations are smaller than the new observations being added. In fact, as shown in the chart, this “base effect” played a significant role in the rise in inflation in March and April, as expected, but had less of an impact in May.
It is now increasingly clear that the new monthly inflation rates are also high. To stabilize inflation at 2%, monthly inflation rates must average 0.17%. However, monthly inflation was 0.4% in February, 0.6% in March, 0.8% in April, and 0.6% in May. While it is too early to say how monthly inflation rates will evolve in the coming months, further declines are needed for the rise in inflation to be temporary.