Fynsa


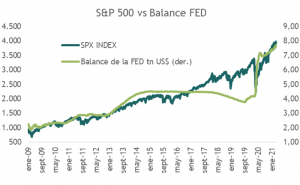
Las trayectorias del desempeño del mercado y el balance de la Fed se correlacionan fuertemente. Los activos totales en el balance de la Fed se han expandido de US$ 2,24 trillones a finales de 2008 al nivel actual de alrededor de US$7,7 trillones, para un crecimiento del 244%, mientras que el S&P 500 subió de 903,25 a aproximadamente 3.900 puntos, obteniendo un crecimiento acumulado de alrededor del 330% durante el mismo período. (ver gráfico 1).
Es cierto, no son números exactamente iguales, pero observe lo que ha pasado en pandemia, cuando las utilidades han caído y todo el retorno de la renta variable se explica por la expansión de múltiplos. El balance de la Fed ha aumentado de 4,67 trillones de dólares el 18 de marzo de 2020 (una semana antes del fondo del mercado) a 7,7 trillones de dólares, con un crecimiento del 65%, mientras que el S&P 500 ha aumentado un 64% durante el mismo período. Eso sí se parece ¿verdad?
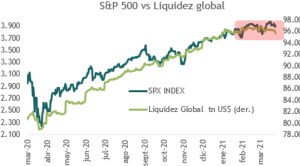
Desde mediano de febrero de este año los mercados de renta variable han tenido dificultades para sostener la tendencia alcista, en medio de un rápido aumento de los rendimientos soberanos que ha puesto a prueba las altas valoraciones del mercado, pero también en medio de una menor liquidez provista por los principales bancos centrales. (ver gráfico 2)
No es que las compras de activos se hayan detenido (los bancos centrales del G-10 comprarían cerca de US$300 billones por mes en 2021), pero sí se ha moderado el ritmo de las mismas. ¿Cuánto durará esto? Es esperable que no mucho ya que los bancos centrales se han vuelto cada vez mas sensibles a los ajustes de liquidez y cómo estos impactan en los precios.
De muestra 3 botones:
El Banco Central Europeo (BCE) señaló hace dos semanas que comprará más deuda para que el alza de los intereses no ahogue la recuperación, y no es que haya aumentado el tamaño del programa de compras (por lo menos no por ahora), sino que el ritmo de estas aumentará.
Las acciones chinas han tenido más dificultes este año, por temas regulatorios, pero también por la expectativa creciente de una política monetaria más restrictiva. China no ha sido tan conservador en sus ofertas de efectivo a los bancos en casi un año, y el Banco Popular de China ha evitado las inyecciones netas de liquidez a corto plazo en el sistema financiero desde fines del mes pasado, lo que aumenta la preocupación de que el acceso a los fondos es cada vez más difícil. ¿Cuánto durara? después de una caída de 15% de las acciones China desde mediados de febrero, probablemente no mucho más.
Las acciones japonesas vieron una venta generalizada en los últimos días, después de que el Banco Central de Japón (BOJ) señalara la semana pasada que está eliminando su objetivo anual de compra de acciones. ¡¡Y sorpresa!! El BOJ tuvo que volver al mercado de forma más agresiva para comprar una cantidad récord de acciones (70 bn) y detener la caída (cosa que de momento ha logrado).