Fynsa


A comienzos de año argumentábamos que los riesgos de correcciones en los mercados habían ido aumentando (https://www.fynsa.cl/newsletter/estrategia-internacional-2/), a propósito de las mayores tasas de interés a consecuencia del proceso de normalización monetaria emprendido por la Reserva Federal.
Avancemos hasta hoy y el S&P 500 acumula una caída de 6,0% en el año (que llegó a ser casi un 10% hasta hace solo una semana), mientras que el Nasdaq dada su mayor sensibilidad a las tasas de interés, dobla las pérdidas del S&P 500 y más allá de que el panorama general de ganancias corporativas sigue siendo sólido, persisten las preocupaciones sobre el endurecimiento de la Reserva Federal y los temores de una inflación obstinada, que se sigue retroalimentando en cadenas de suministro altamente estresadas, precios de la energía presionados por tensiones geopolíticas (petróleo ya opera en US$90 en barril ) y presiones salariales que fueron más evidentes en los datos de empleo de esta semana.
Para complicar las cosas no es que solo sea la reserva federal la que ha ido subiendo el tono respeto a un retiro más anticipado y probablemente más rápido de los estímulos, sino que la mayoría de los grandes bancos centrales (con la excepción de China) están acelerando el retiro de estos.
Primero (entre los grandes) fue el Banco de Inglaterra quien sorprendió a los inversores con un aumento de tasas a mediados de diciembre (después de prometer que no lo harían), para luego esta semana poner fin al QE (compras de activos) y subir las tasas nuevamente.
También esta semana, la presidenta Lagarde del Banco central europeo (BCE) señaló un giro político agresivo, dados los mayores riesgos inflacionarios, con lo que ahora se espera una salida política sustancialmente más temprana.
Si hasta, las especulaciones sobre la normalización de la política monetaria han llegado a Japón, el más moderado de todos dentro de desarrollados.
En la práctica para el caso de EEUU, el mercado ya está incorporando 5 aumentos de tasas para fin de año (y un 25% de probabilidad de un aumento de 50 pb en marzo), las compras de activos se acabarían en marzo e incluso se está valorando un comienzo anticipado del QT (reducción del balance).
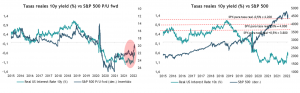
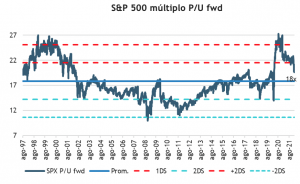
Con este telón de fondo, las presiones de tasas de interés se mantienen altas ejerciendo presión sobre las valorizaciones del mercado. Desde una perspectiva fundamental, el aumento de las tasas de interés ha explicado la totalidad de la caída del S&P 500. El rendimiento real del Tesoro de EEUU a 10 años aumentó en 60 pb (-1,1% a -0,5%) entre el máximo histórico del S&P 500 del 3 de enero y el día posterior a la reunión del FOMC de la semana pasada. En ese mismo periodo el múltiplo P/U fwd del S&P 500 paso de 21,8x a 19,5x, igualando la caída del mercado.
Por supuesto, una pregunta recurrente por estos días es si lo peor de este ajuste ya pasó o si todavía podemos enfrentar mayores pérdidas hasta que los mercados se estabilicen. Como referencia, todo lo demás constante, el S&P 500 caería aproximadamente un 10% adicional a 4.000 si el rendimiento del Tesoro en términos reales subiera desde los actuales -0.6% a 0% y un 15% a 3.800 si subiera otros 50 pb.
En este sentido un S&P 500 en 4.000 puntos, seria consistente con una reversión a la media en términos de valorización (en torno a 18x) y seguramente una gran oportunidad de compra.
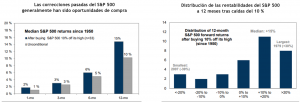
De alguna manera “veníamos un poco mal acostumbrados” con ajustes que durante el 2021 no superaron el 5% y que rápidamente el mercado salía a comprarlos. De hecho, nosotros mismos promovimos muchas veces el “buy the Dip”, pero evidentemente las cosas han cambiado. Pero la pregunta que sigue es ¿son tan infrecuentes las correcciones de 10% o más? sin llegar a un mercado bajista (caídas superiores al 20%). La evidencia muestra que no.
Ha habido 33 correcciones del S&P 500 del 10% o más desde 1950. El episodio mediano duró aproximadamente 5 meses y abarcó una disminución de máximo a mínimo del 18% (que en la práctica seria consistente con un S&P 500 en torno a 4.000 puntos). Un inversor que compra el S&P 500 un 10 % por debajo de su máximo, independientemente de si era el mínimo, habría obtenido un rendimiento medio del 15% durante los siguientes 12 meses (positivo el 76% del tiempo) y las correcciones rara vez se convierten en mercados bajistas a menos que la economía se dirija hacia una recesión (que nos es nuestro caso base).
Fuente: Goldman Sachs
Nuestra recomendación ha sido ser muy conservadores en términos de duración a propósito de los riesgos de mayores tasas de interés. Pero, así como en la renta variable hablamos de “reversión a la media” en términos de valorizaciones, en la renta fija uno puede aplicar un enfoque similar.
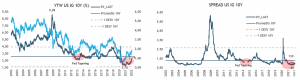
Los spreads corporativos para la categoría IG US han subido del orden de los 25 pb, un movimiento relativamente acotado y ordenado. Tiene sentido, la economía esta funcionado y los balances de las empresas son robustos. Pero con las mayores presiones de tasas de interés no debería extrañarnos alzas adicionales para converger a niveles promedios de 130 pb. (un movimiento muy parecido en la práctica al tapering de 2013).
Una derivada positiva y que en su momento debería evaluarse como oportunidad, es que las yield comienzan a verse más “seductoras”. Hoy la categoría ofrece una yield de 2,8% (que podría acercarse al 3%), esos son más de 100 pb de hace solo 6 meses y en un mundo con tan poca tasa que ofrecer seguramente se la pelearan.
Humberto Mora
Estrategia e Inversiones