If we're closer to the "peak of inflation," then we should be close to the market bottom
Share
Are we getting closer to the peak of inflation?
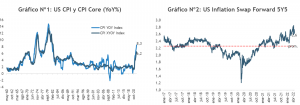
Despite the rise in realized inflation, the market still views the Fed as credible in its fight against inflation. The markets’ estimate of what the 5-year, 5-year forward equilibrium rates will be (see Chart No. 2), show inflation expectations at 2.6%, which is only modestly higher than the Federal Reserve’s 2% target, given that the CPI has historically exceeded the Federal Reserve’s preferred PCE inflation measure by about 30 basis points.
Source: FYNSA Strategy; Bloomberg
Core inflation measures have also risen, but the groundwork is being laid for a slowdown, particularly in housing inflation. (See Charts No. 3 and No. 4)
Source: JPMorgan
This component of U.S. inflation seems worth highlighting given the relative weight of shelter (housing) in overall inflation and services inflation. This category accounts for one-third of the total basket and 50% of services inflation. In this regard, the price trends in the sector described above appear promising, and “more restrictive financial conditions” should have the desired effect. (The 30-year mortgage rate has risen from 3.25% at the end of 2021 to 5.57% today, well above the yield on the 30-year Treasury bond.)
Source: FYNSA Strategy; Bloomberg
The rest, by the way, hinges on inflation in goods. Here, the pressures range from geopolitics to supply chains. Incidentally, the lockdowns in China have only exacerbated these risks to supply chains. I’d go further: the lockdowns in China over the past few weeks account for much of the market stress caused by the “stagflationary combination” they entail, but now that the new outbreaks are “under control,” it’s expected that these pressures will begin to ease going forward.
The underlying drivers of inflation, such as prolonged delivery times from suppliers and the prices that companies charge consumers, may be peaking. Thus, inflationary pressures appear to be easing, even before we factor in the sharp tightening of U.S. financial conditions. The “base effect” should do the rest.
Ultimately, this will amount to a “delicate balance” between inflation in goods—which should continue to slow down later in the second half of the year—and “stickier” inflation in services.
If we are closer to the “peak of inflation,” then it’s fair to say that we should be close to the market bottom.
Most of the correction in equities so far this year has been due to a compression in valuations. We believe the forces that have been pushing stock prices lower may begin to subside: the war in Ukraine no longer appears likely to escalate into a broader conflict; the number of new COVID cases in China has been cut in half; and global inflation may be peaking.
As analysts' corporate earnings estimates rise, the compression of valuations has driven the S&P 500’s 15% decline year-to-date. The consensus forward P/E ratio has fallen 16%, from 21x in early 2022 to 17x currently, closely tracking the rise in real interest rates (Chart No. 6). In the last two months alone, 10-year real rates have risen from -1.0% to +0.3%, marking their first foray into positive territory since early 2020. So far this year, the S&P 500’s earnings yield (the inverse of the P/E ratio) has risen by 90 basis points (from 4.8% to 5.7%), nearly matching the 125-basis-point increase in the real Treasury yield.
Because the P/E multiple has moved in tandem with the risk-free rate, the “yield gap”—the difference between the EPS yield and the real Treasury yield, an indicator of the equity risk premium (ERP)— is close to where it started the year. The current yield gap of 550 basis points is close to its 10-year average (560 basis points), although much wider than its 25-year average (440 basis points). (Chart No. 7).
Source: FYNSA Strategy; Bloomberg
Looking ahead, the stock market’s trajectory will depend on the outcome of the Fed’s battle against inflation. In our base-case scenario, GDP and corporate earnings continue to grow, albeit at a slower pace than in 2021. Financial conditions will continue to tighten, but the impact of higher rates on stock valuations should be at least partially offset by a narrowing yield gap.
If the risk of a recession increases, interest rates may fall, but not enough to prevent stock multiples and stock prices from continuing to decline. In a recessionary scenario, analysts would cut their earnings forecasts. The average decline in EPS during U.S. recessions since 1949 has been 13%. Real Treasury yields could also fall to -0.5%, 50 basis points above their all-time low. If the yield spread were to widen to 650 basis points—close to its peak in Q4 2018—the P/E ratio would contract to 17x, and the S&P 500 index could fall to 3,600 (-10% from today’s level). Such a decline in the S&P 500 would represent a 24% drop from peak to trough, matching the average decline during past recessions.
Our best estimate at this point is that the U.S. economy will manage to avoid a recession—at least not an imminent one. The statement following the FOMC’s decision to raise the federal funds rate by 50 basis points—a widely anticipated move— emphasized that the Fed expects a “soft landing” for the economy to be possible, assuming that household spending and business investment “remain strong” and that inflation would begin to slow in the second half of 2022 ( though it acknowledged that virus-related lockdowns in China “are likely to exacerbate supply chain disruptions” and that the committee is “closely monitoring inflation risks”). Under these assumptions, S&P 500 levels significantly below 4,000 points would not be justified, and we maintain our fair value estimates closer to 4,600 points.
Source: FYNSA Strategy; Bloomberg
Finally, if we are closer to the “peak of inflation,” it is fair to say that we should be near the market bottom. Therefore, for traditional investment horizons (between 12 and 18 months), falling inflation and easing recession fears could cause stocks to recoup a significant portion of their losses.
Humberto Mora
Investment, Finance, and Business Manager; Stockbroker
Previous
Investment Opportunities
Rising Interest Rates and the Outlook for the U.S. Real Estate Sector


 Source: FYNSA Strategy; Bloomberg
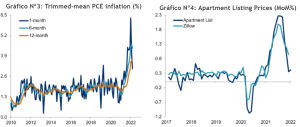 Source: JPMorgan
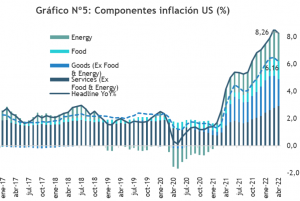 Source: FYNSA Strategy; Bloomberg
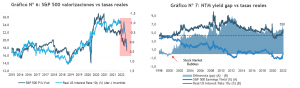 Source: FYNSA Strategy; Bloomberg
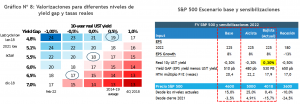 Source: FYNSA Strategy; Bloomberg