
It's no surprise that the exchange rate is rising higher and higher, which leads us to believe that its lows and values seem to be higher than expected.
A country's currency can be understood as a sort of extension of its economy (though not always in a direct correlation). In an economy like Chile’s, the exchange rate has been tied to what has historically been our largest export: copper. However, starting from a zero base, in early 2013 and tracking the performance of the Chilean peso and copper, we observed a significant decoupling (and, more importantly, a gap that did not close).
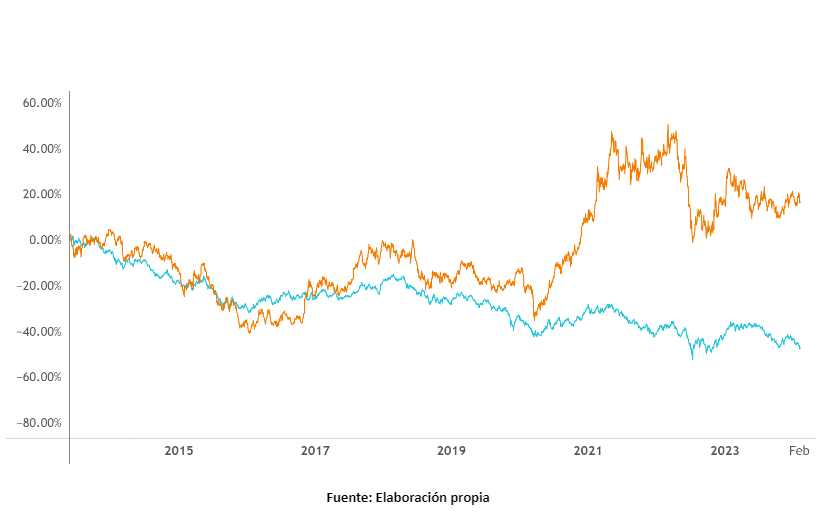
It is in this context that we seek to reflect on and recall events that may have shaped the evolution of our currency—important moments that helped fuel the love-hate relationship we have with the dollar. That said, it is worth mentioning the decoupling observed between 2019 and 2020, with the social unrest and the pandemic (and, more importantly, how this gap has not closed). Was this a local factor, or did the pandemic wipe out currency values?
Now, when we want to know how the U.S. dollar is performing, a well-known tool is the DXY index: A measure that weights various currencies to gauge the relationship between the dollar and the global economy. Although the peso has historically moved in a certain correlation with this index, we can see that since October 2019, the same decoupling has emerged that we observe in the chart showing copper returns.
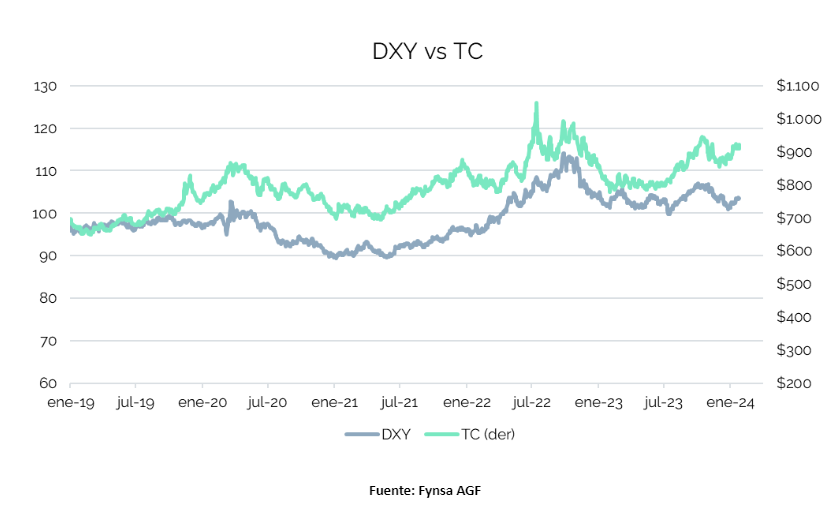
This, in addition to reinforcing the previous point, may explain why the gap did not close. Looking at it even more closely, this gap appears to have widened again in a manner similar to what we saw in the first chart.
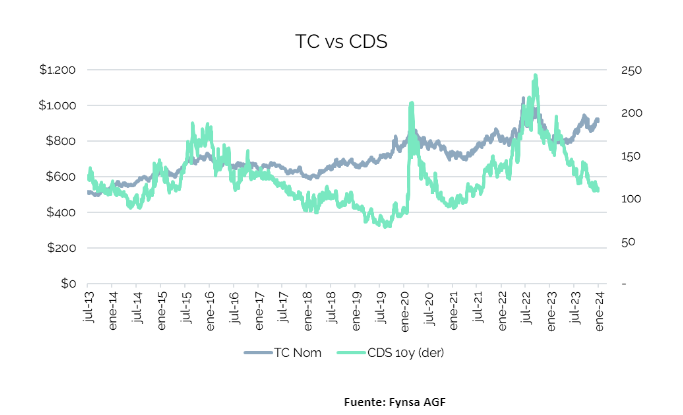
Examples such as the ones above are just a sample used to illustrate how certain data—which were historically relied upon for their ability to predict exchange rate movements—now seem unable to explain values that are distorted by their own volatility.
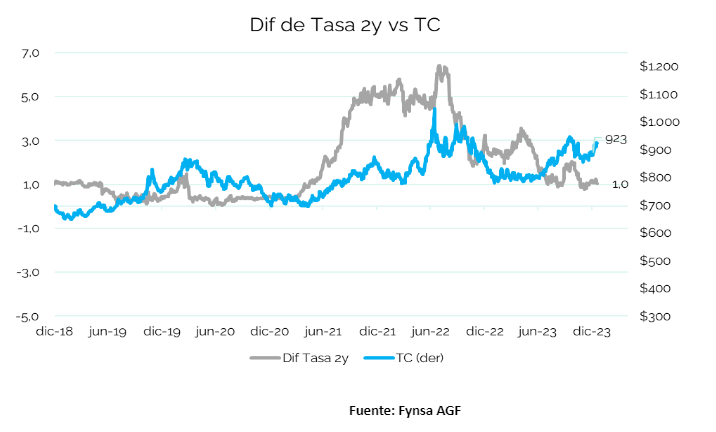
The following charts show that movements in CDS spreads do not seem to explain the phenomenon, as they reveal a widening gap; nor do interest rate differentials with the United States seem to explain it.
During the period when interest rates rose—from mid-2021 through late 2022—we observed the peso’s value move from below $750 to over $900. At times, it even exceeded $1,000. During this period, the monetary policy rate rose from 0.5% to 11.25%.
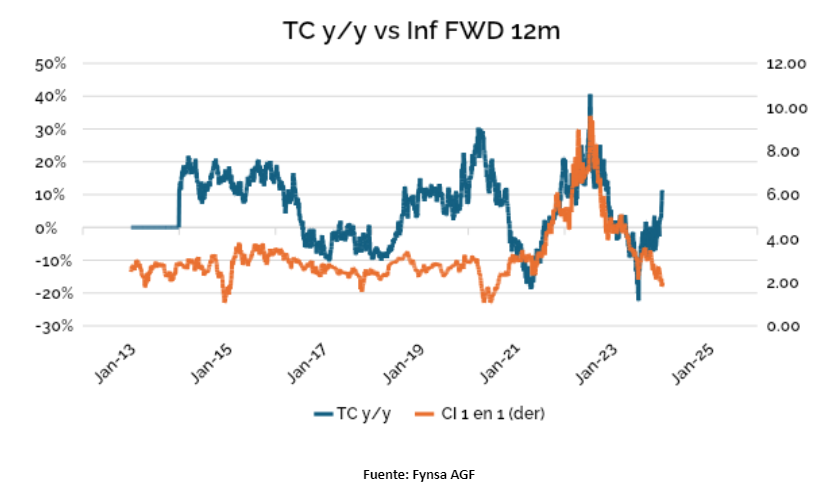
 Against the backdrop of falling interest rates—as projected by both the Central Bank and the Federal Reserve—it will be particularly important to have a clear understanding of how our currency will move and how that will affect our daily lives. In the immediate term, this last chart shows how the inflation forward It has also become decoupled from the exchange rate… the certainties and correspondences that have been so sorely missed of late—things that the exchange rate (and perhaps something else) took away.
Gabriel Haensgen
Fynsa AGF Team