
In a context of global rate cuts not free of difficulties and where the amount and volume of the cuts have given us more doubts than certainties, we have witnessed how the deposit party continues its course towards the end. Time deposits became a safe and profitable investment alternative in a complex and unstable economic context, in light of the rate hike by the Central Bank that took the Monetary Policy Rate (MPR) to 11.25%, a value it maintained from late 2022 to mid-2023. Today, the picture looks different, and although the speed and intensity is a matter of debate, the current levels of rates and expectations of their movements lead us to an inevitable conclusion regarding this type of instrument: their return will continue to decline.
Graph 1: TPM Evolution, Central Bank of Chile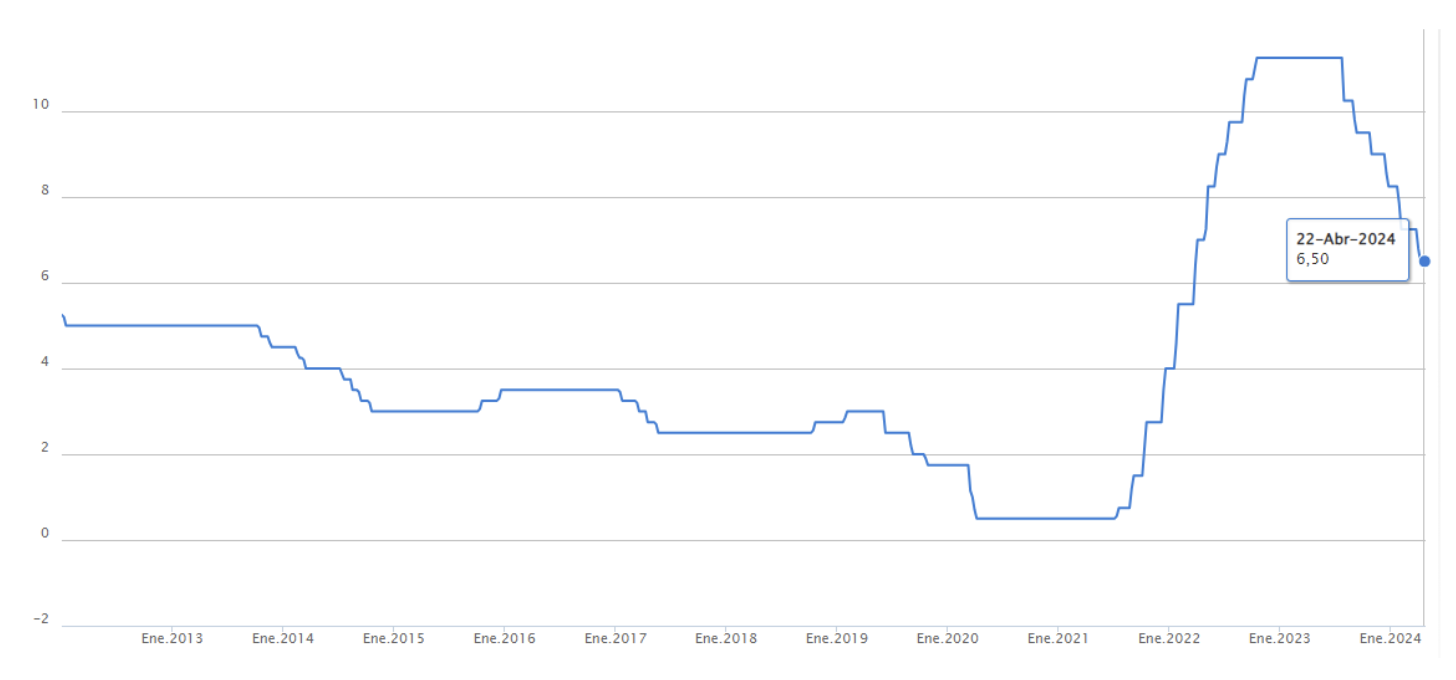
Graph 2: Implied forward MPR on the April 16 Swap, Fynsa AGF
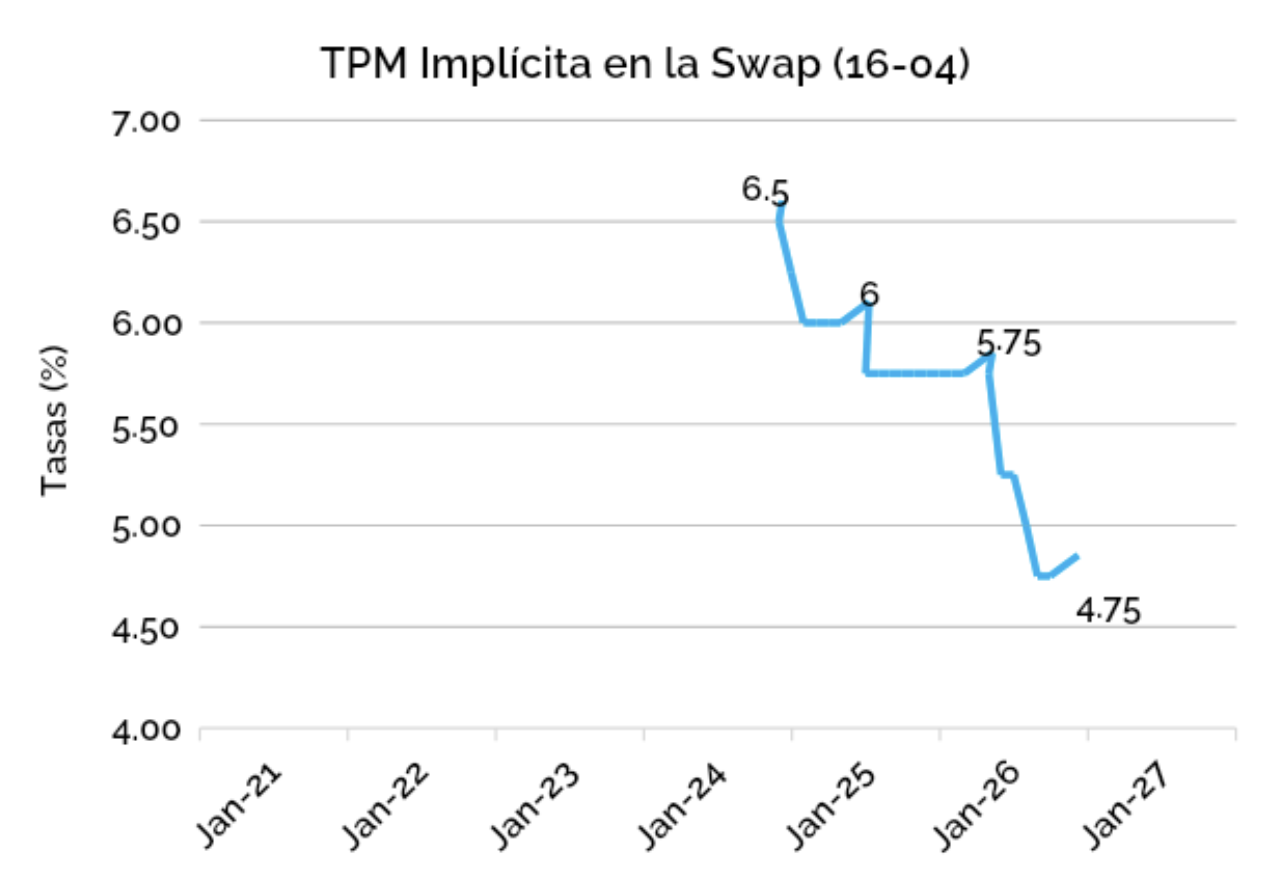
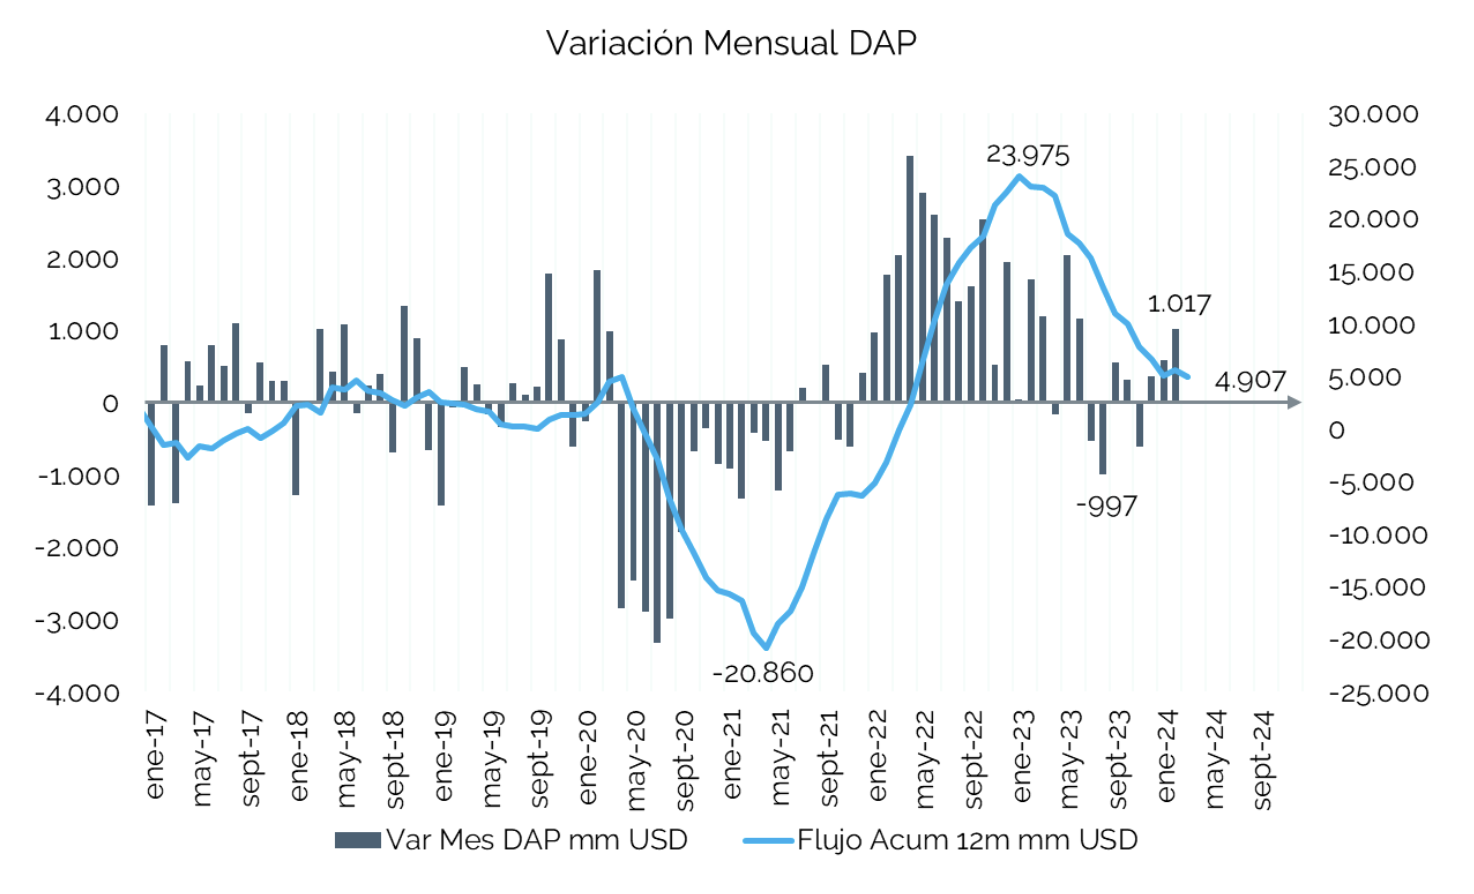
Today, with levels somewhat above 6% per annum and with their future prospects, it is not surprising that other investment alternatives are gaining attractiveness. We can observe this by looking at the 12-month moving flows of Time Deposits, seeing how they peaked in the face of rising rates, and their persistent fall thereafter.
Graph 3: Monthly Variations and Cumulative Flow of Time Deposits, Fynsa AGF with CMF Data
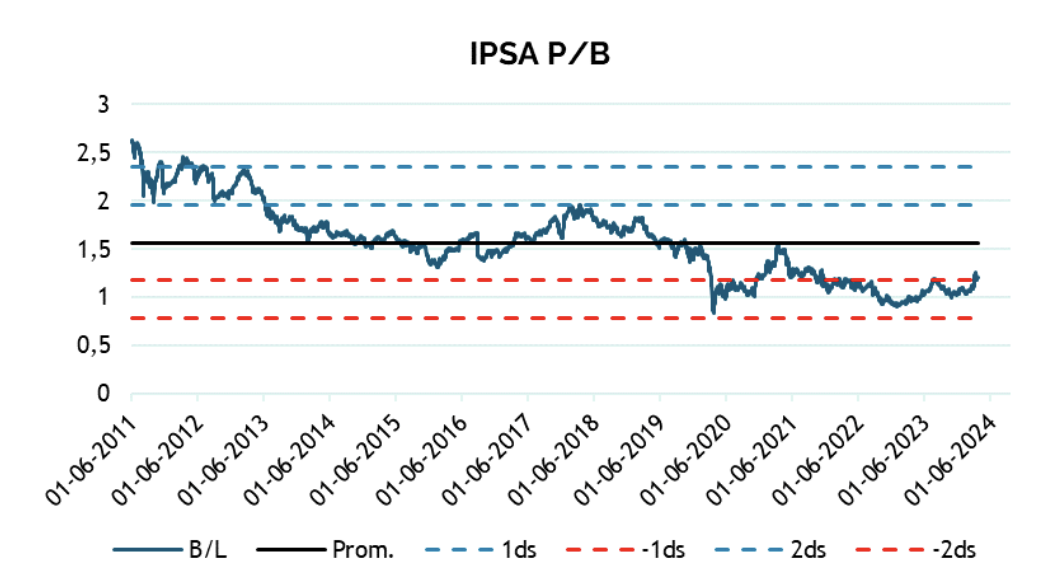
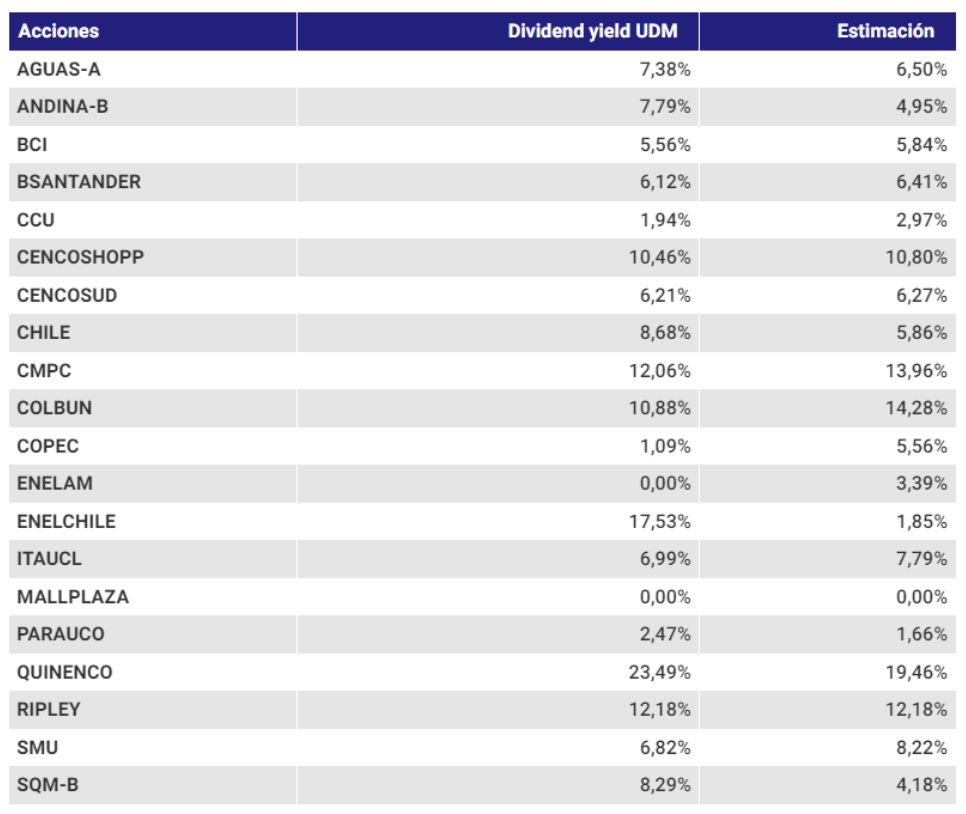
In this context, it is to be expected that another type of asset will begin to attract attention in the search for better returns previously perceived by deposits, such as longer duration assets and the opportunity presented by the Equities markets. Domestic equities appear as an interesting option, not only as a capital gains alternative, but also in terms of dividends from the dividend yields of its components.
Chart 4: Historical P/B IPSA ratio, as of 12/04 with values around 1.16 times. 26% below its historical average (1.57).
Graph 5: IPSA forward PU evolution, as of 12/04 with values around 10.25 times. Under one standard deviation from its historical average (13.82).
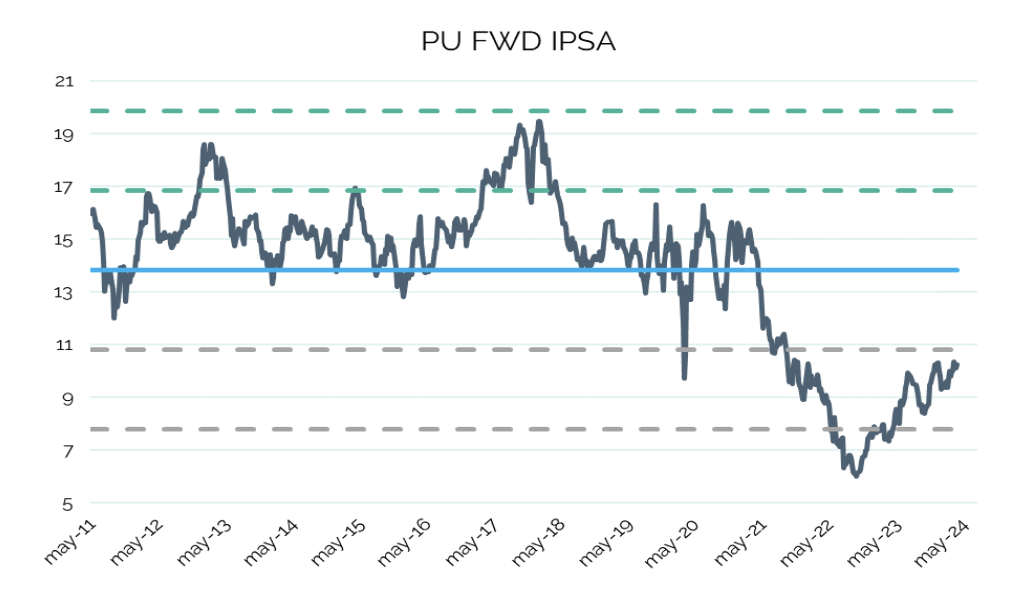
Table 1: Dividend Yield Estimates, El Mercurio Investments with Bloomberg Data
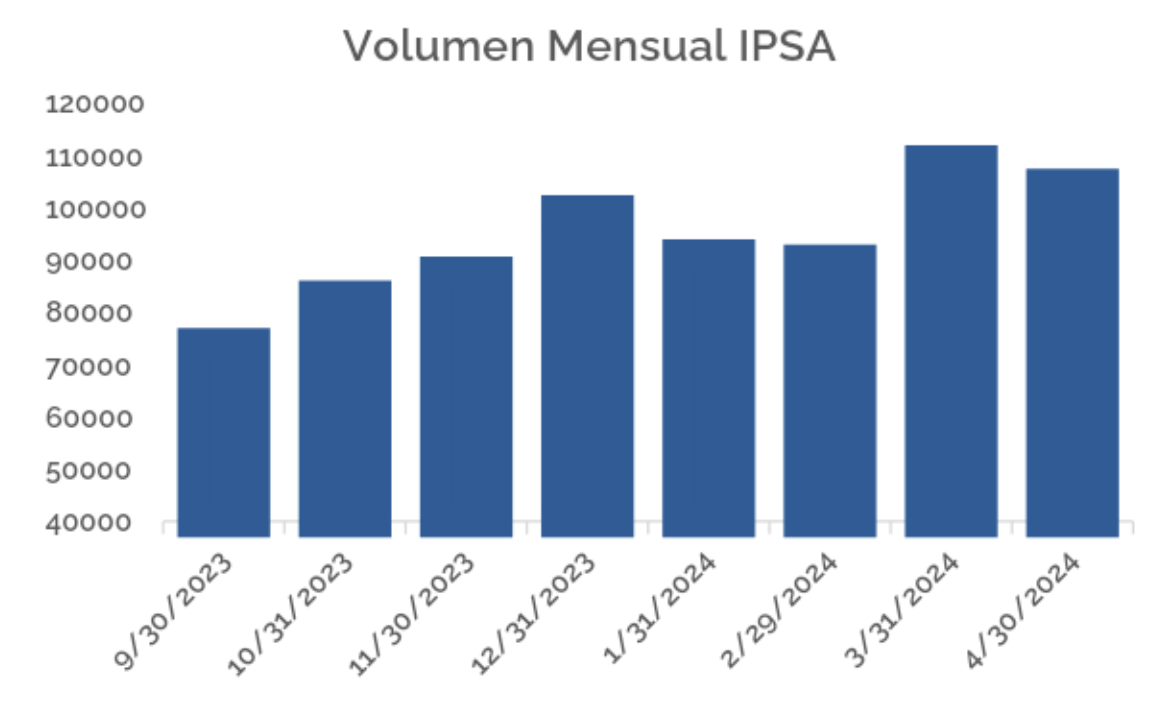
In view of the above, it is interesting to see how the liquidity of the domestic equity market can be strengthened by receiving incoming flows in parallel to the outflow of deposits, given the opportunity of better returns in a more liquid context. We can observe an increase in liquidity in the IPSA during the year by looking at Graph 6, which shows the monthly averages of daily traded amounts. In conjunction with the above, it is not surprising to see news about the growth of equity mutual funds so far this year. so far this year.
Graph 6: Evolution of average monthly liquidity, April to 19/04. Fynsa AGF with data from the Santiago Stock Exchange.
Finally, we have observed an increase in liquidity in domestic equity markets as deposits become less attractive, and everything seems to indicate that this trend will continue. In this context, and in view of interesting return options through capital gains and dividends, we will see a market with more volume and interesting conditions to invest.
Gabriel Haensgen
Financial Funds Analyst Fynsa AGF