
Recientemente publicamos nuestra visión y estrategia para el segundo trimestre de 2023 (VER ACÁ) donde dejamos de manifiesto los desafíos que enfrentan tanto la economía como los activos en los próximos meses, dadas las recientes tensiones en el sector bancario que implican estándares crediticios más estrictos y un mayor riesgo de recesión.
En este contexto, una pregunta recurrente en las últimas semanas es por qué los activos de riesgo lo han estado haciendo bien en este inicio de año (S&P 500 ha rentado ~ al 8%), a pesar de un incremento de los riesgos de recesión. Podría dar varias razones, pero siendo prácticos, lo resumiría en “menores presiones de tasas de interés”, lo que ha propiciado cierta rotación desde sectores value/cíclicos a sectores más sensibles a tasas de interés, con balances más sólidos, utilidades más resilientes y más “aislados” de las tensiones en el sector financiero.
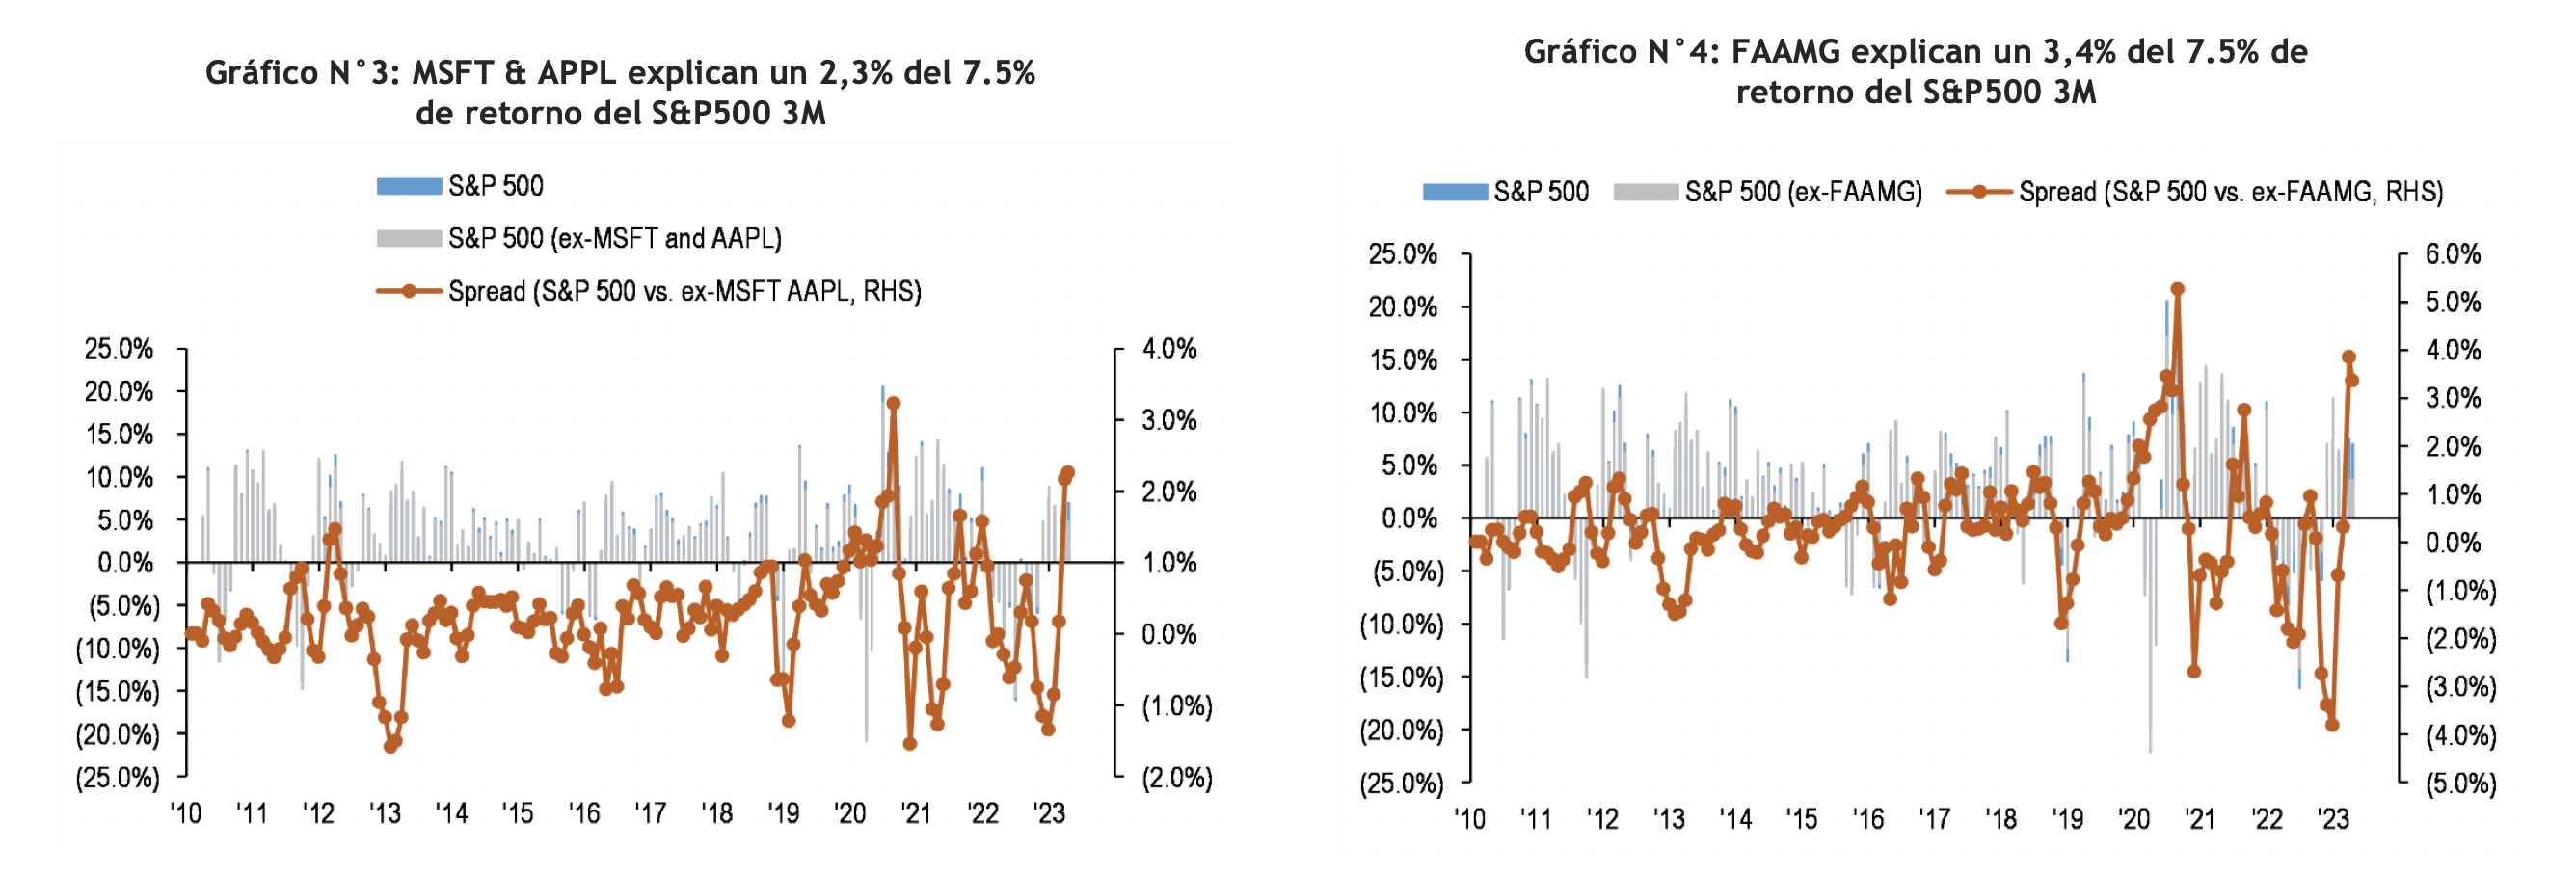
Específicamente, Crecimiento/Tecnología han vuelto a retomar el liderazgo del mercado debido a la caída de las tasas de interés, positivos resultados corporativos (MSFT,GOOGL y META sorprendieron al alza en sus entregas de resultados durante esta semana) y la popularidad de ChatGPT, que ha sido un catalizador para ciertas acciones seleccionadas de IA (MSFT, GOOGL, AMZN, META, NVDA, CRM*) que explican el 53% del rendimiento del S&P 500, el 54% del Nasdaq 100 y el 68% del estilo growth en lo que va del año.
Por supuesto, podemos estar de acuerdo en que el potencial de crecimiento de la IA es enorme, y las grandes tecnológicas en EE.UU. tienen un buen historial para capturar estas tendencias, pero convengamos que las valorizaciones actuales (19x P/U fwd para el S&P 500 y 25x P/U fwd para el caso del Nasdaq), son muy difíciles de justificar en la etapa actual del ciclo económico en la que nos encontramos, y hay lecciones aprendidas de 2022 en cuanto a la desventaja que puede significar pagar premios tan altos por ciertas acciones/sectores, más allá de su potencial de crecimiento.
Por lo demás, tasas mucho más bajas desde los niveles actuales podrían ser más una señal de preocupación que otra cosa, en el entendido que un treasury 10y al 3,5% ya incorpora una Reserva Federal mucho más moderada en adelante y si las tasas siguen cayendo de aquí en más, será porque estamos más cerca de una recesión que por buenas razones. Y si las tasas suben, se transformarían en un obstáculo para valorizaciones ya altas en términos históricos.
Y más allá de que los resultados corporativos del 1T23 han sorprendido al alza, tampoco han sido suficiente para empujar al mercado a un tramo superior (el S&P 500 cotiza prácticamente en los mismos niveles de hace 2 semanas, cuando se inició la entrega de resultados) y creemos que eso en parte tiene que ver con perspectivas decrecientes para el crecimiento de utilidades en adelante, por menor demanda, mayor erosión de márgenes y por una serie de riesgos asociados a menor liquidez y oferta monetaria, el techo de la deuda, y potenciales eventos crediticios derivados de crisis bancaria, entre otros.
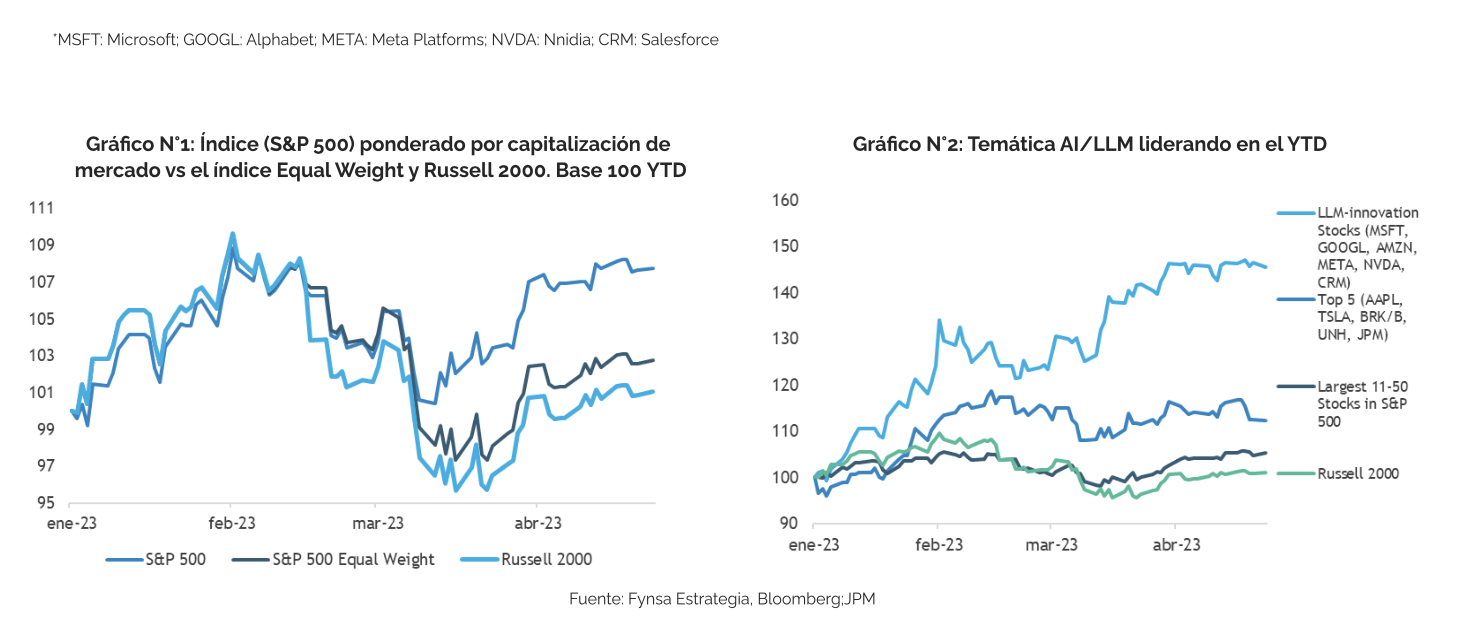
Pero volviendo a los liderazgos del mercado este año, también es evidencia de un mercado “poco saludable” (comentamos previamente que solo 6 acciones explican más de la mitad del desempeño del S&P 500). Otra forma de verlo es comparando el desempeño del índice (S&P 500) ponderado por capitalización de mercado vs el índice Equal Weight o el Russell 2000. Así, mientras que el primero ha rentado ~ al 8%, el segundo tan solo un 2,7%, y las acciones Small Cap, más sensibles al ciclo económico (Russell 200), han rentado apenas un 1% (ver gráficos nº1 y nº2).
En ese sentido, nos gustaría compartir las conclusiones de un informe publicado recientemente por el banco de inversión JP Morgan, que plantea que el liderazgo de los sectores de Crecimiento/Tecnología suele ser indicativo de un ciclo de desaceleración/recesión y que, en el episodio actual, la concentración del mercado en unas pocas acciones de crecimiento ya ha alcanzado niveles extremos.
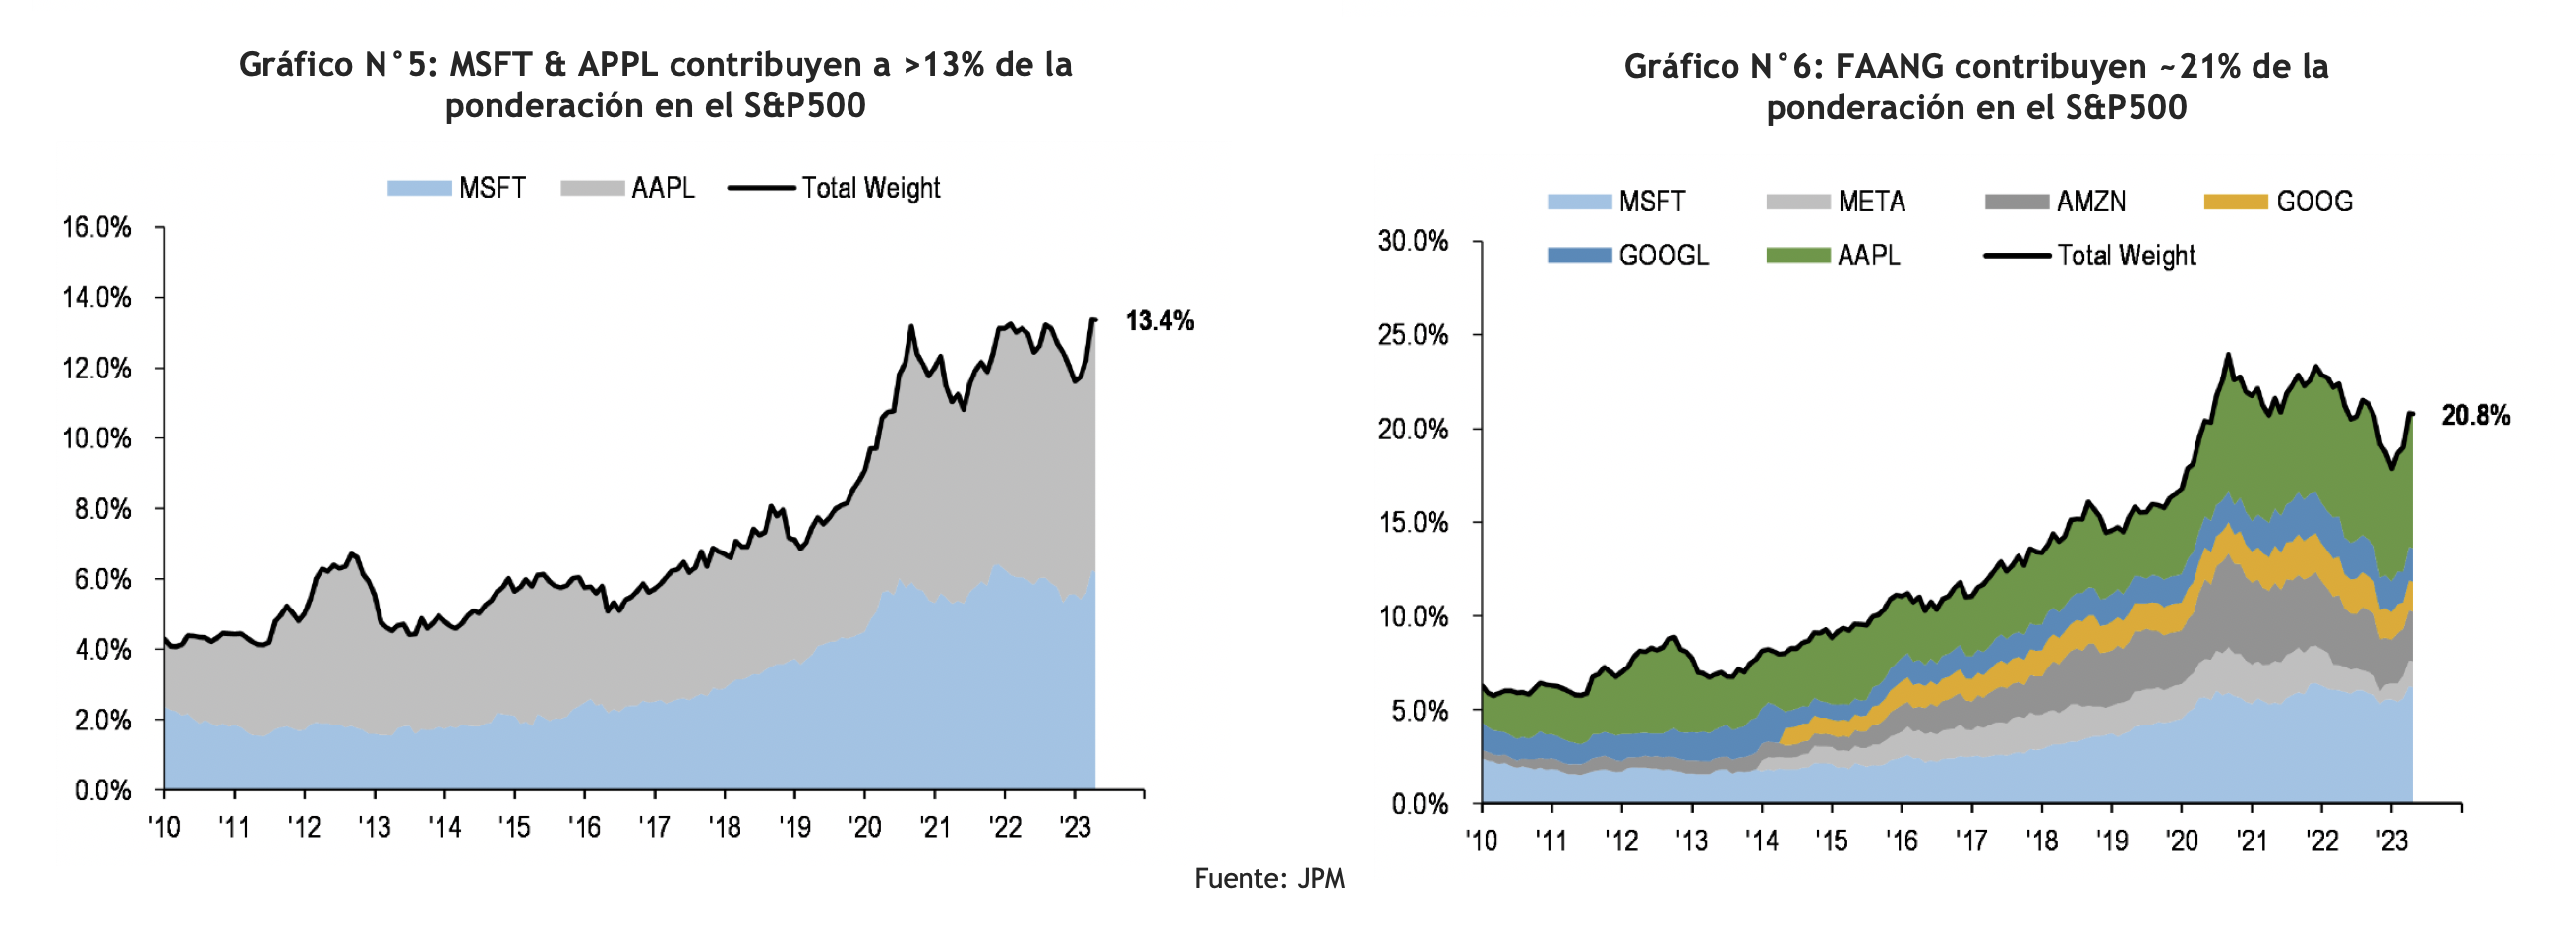
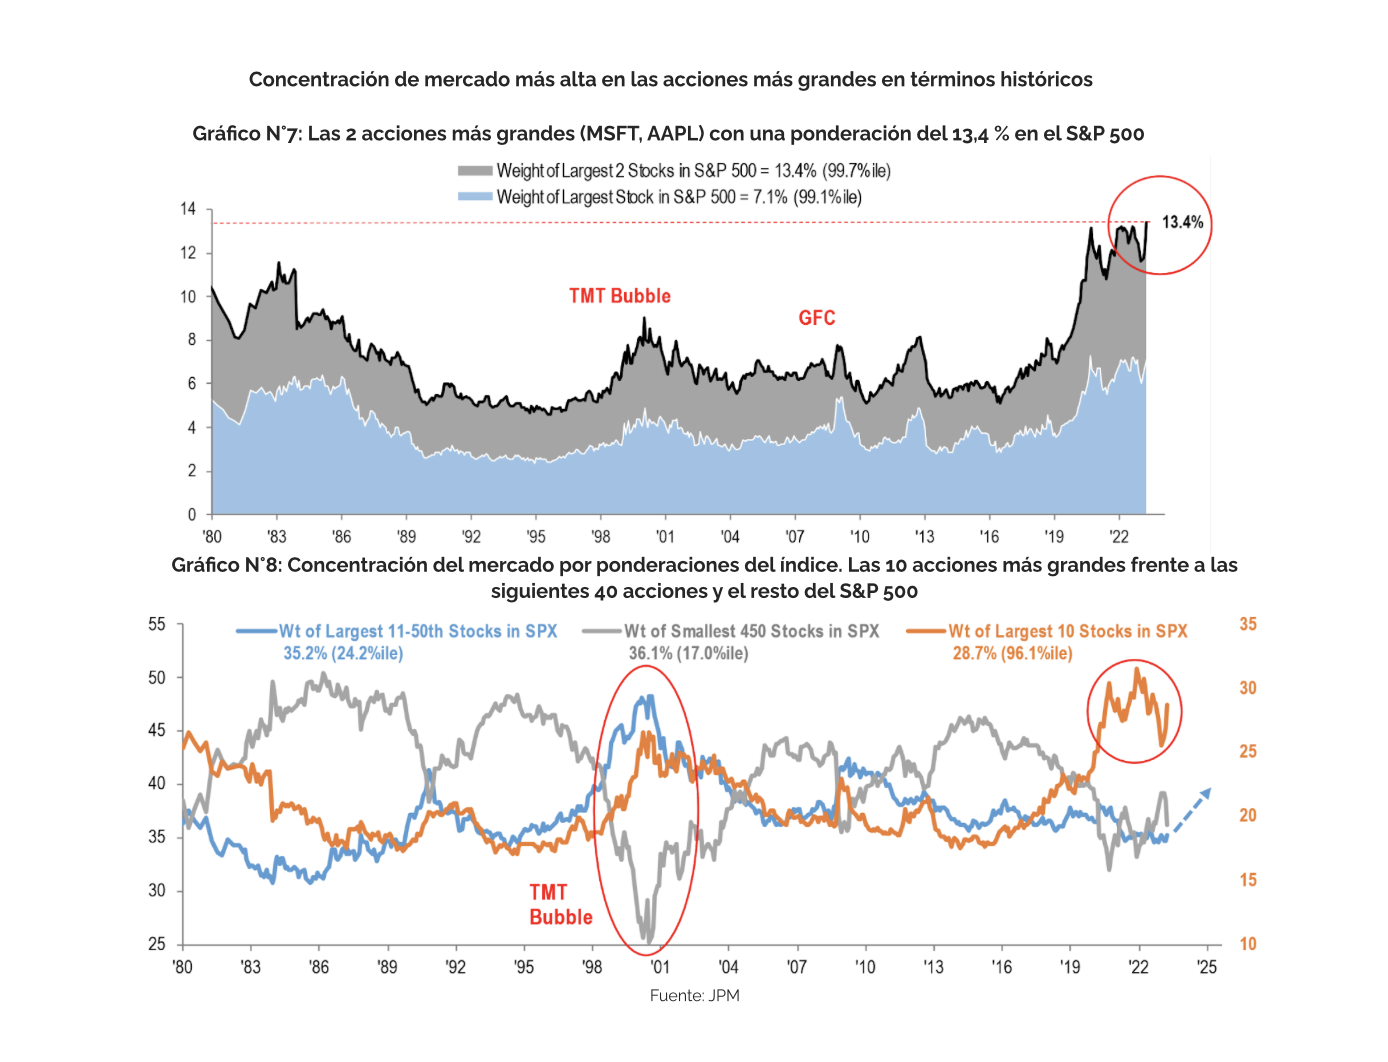
Mercado impulsado por solo un puñado de acciones a medida que el liderazgo se deteriora. Apple y Microsoft son las acciones más importantes del S&P 500 y representan ~14% de la ponderación del índice (ponderación de las 2 acciones principales como % del índice S&P 500 en nuevos máximos). En los últimos 3 meses, el índice S&P 500 subió ~7,5%, del cual el 2,3 % fue impulsado solo por estos dos nombres (~1/3 de los retornos). Mirando a continuación las FAAMG, observamos que representan ~21% de la ponderación del índice y contribuyeron con ~3,4% al retorno total de ~7,5% durante ese mismo período (~1/2 de los retornos). Además, todo el ~7.5% del rendimiento del S&P 500 puede explicarse completamente por solo 28 acciones. (Ver gráficos del n°3 al n°6)
10 vs. las próximas 40 acciones del S&P 500. En una comparación histórica, la ponderación actual del índice S&P 500 en las 10 acciones más grandes es ~29% y está en el percentil 96% desde 1980 (superior a TMT y GFC, solo inferior a los niveles máximos de COVID, mientras que la ponderación del índice en las acciones más grandes del 11 al 50 dentro del S&P 500 se encuentra en el percentil 24). (ver gráfico n°7 y n°8)
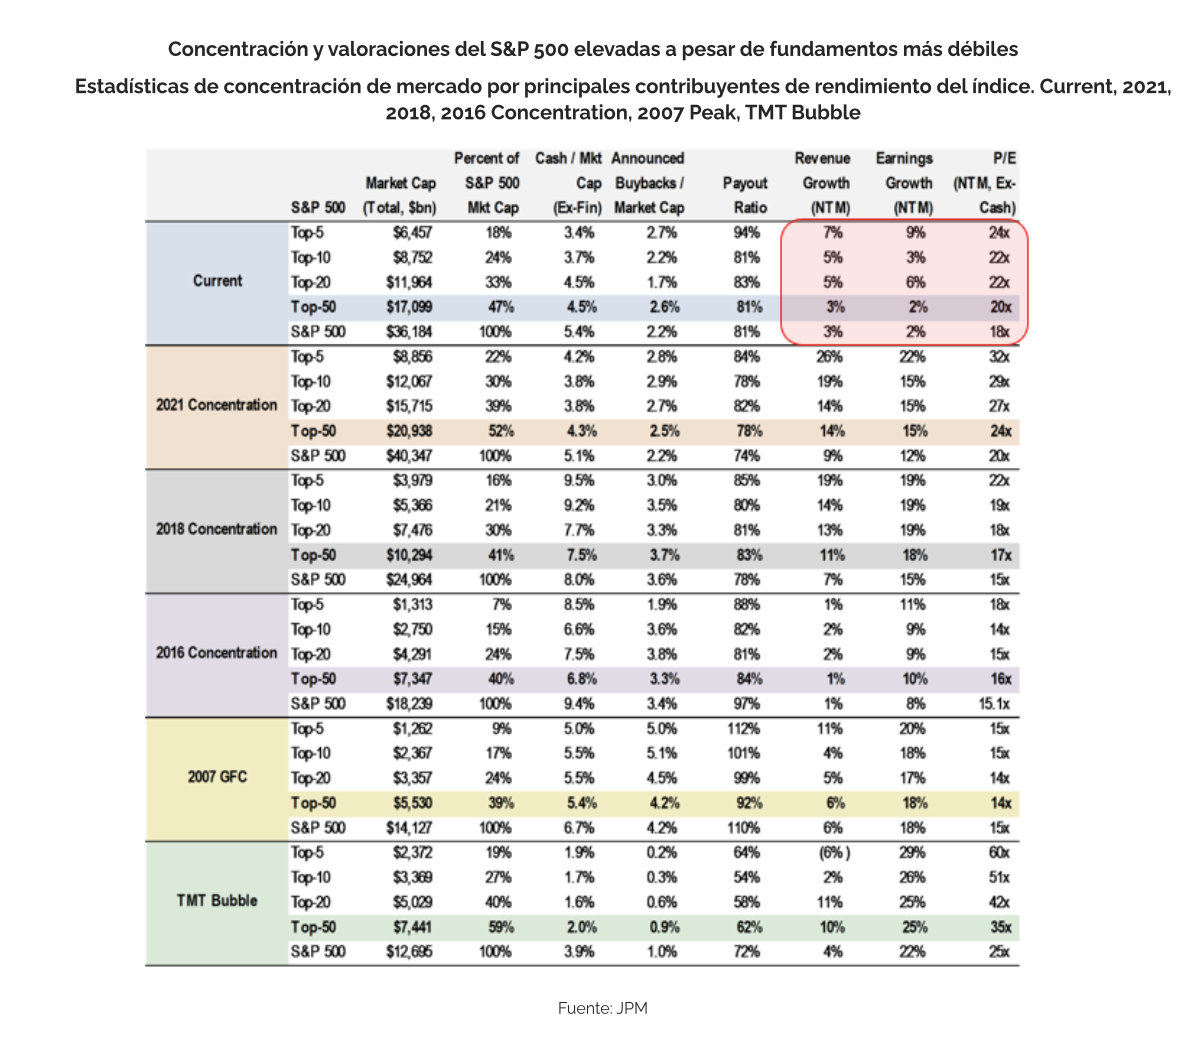
Finalmente, como muestra la tabla a continuación, existe una desconexión significativa entre la valoración y el crecimiento de las principales acciones que contribuyen a la rentabilidad del mercado. En el episodio actual de concentración alta y creciente, los inversionistas están pagando la valoración más alta (con la excepción de 2021) a pesar de que la perspectiva de crecimiento de las utilidades es la más baja. Esto es similar a otras rotaciones defensivas que se observan antes de una desaceleración del ciclo económico.
Como recomendación en términos de allocation, a nivel agregado reduzca su exposición a renta variable en favor de la renta fija. Dentro de la renta variable, a nivel regional sobre pondere mercado ex – US donde las valorizaciones con más atractivas. Dentro de EE.UU. y en términos de estilo y sectores, considere alternativas más defensivas (Quality, Healthcare, Utilities, Staples).