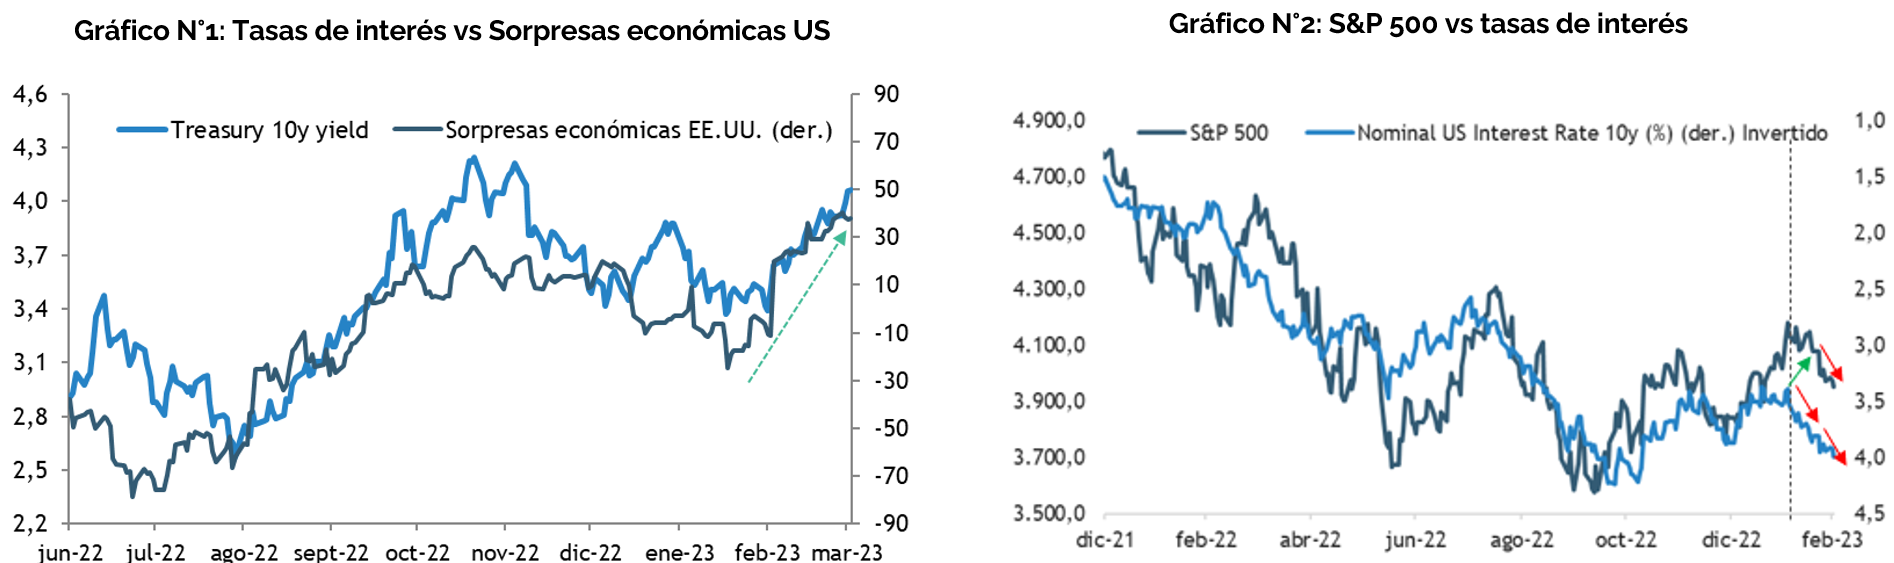
Shortly after the Fed’s meeting in early February, and following a series of stronger-than-expected economic data points, interest rates have risen significantly (see Chart 1), while equity markets initially rebounded, only to partially reverse their gains so far in 2023. This created a divergence between equities and interest rates that has not yet fully closed, despite the recent market decline. (see Chart No. 2)
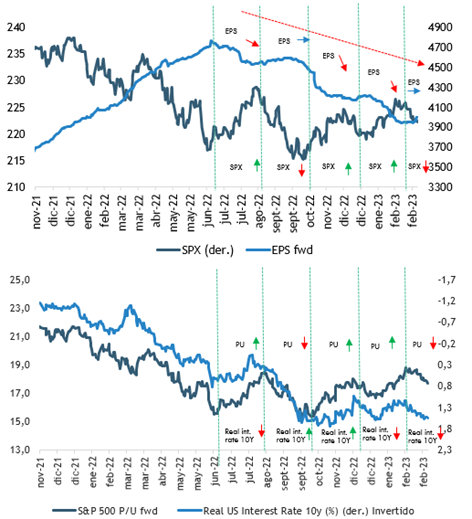
If you are a regular reader of this section of our newsletter, you may recognize Chart 3, which shows how expected earnings interact with the performance of the S&P 500, but above all the relationship between interest rates and market valuations (bottom panel).
When we published our 2023 outlook for international assets (See here) , we highlighted that higher interest rates put pressure on valuations throughout 2022, but that in 2023 the focus will shift from valuations to corporate earnings, in an increasingly challenging macroeconomic environment. However, what is evident in Chart No. 3 is that, at least so far, the focus remains largely on interest rates. Since mid-2022, the market has gone through a series of declines and recoveries that can be explained almost entirely by the trajectory of interest rates, which drive expansions or contractions in multiples, while expected earnings have been persistently trending downward.
Chart 3: S&P 500. Price vs. EPS (top panel); P/E Ratio vs. Real Interest Rates (bottom panel)
The question that follows, then, is: Why hasn’t the market reacted more strongly to the renewed rate pressures? It is important to note that the first part of this year’s rally can be attributed to positive news regarding China’s reopening, moderating U.S. inflation, and falling natural gas prices in Europe, as well as certain more “technical” factors, such as short covering. Thus, the narrative shifted from a likely recession to talk of a “Goldilocks” scenario and then a “soft landing,” which has marginally improved corporate visibility and led to a compression of the equity risk premium (ERP), which has fallen from around 250 basis points at the end of 2022 to just 170 basis points at the end of February, the lowest level in 15 years. (see Chart No. 4)
Chart No. 4: S&P 500. Equity Risk Premium
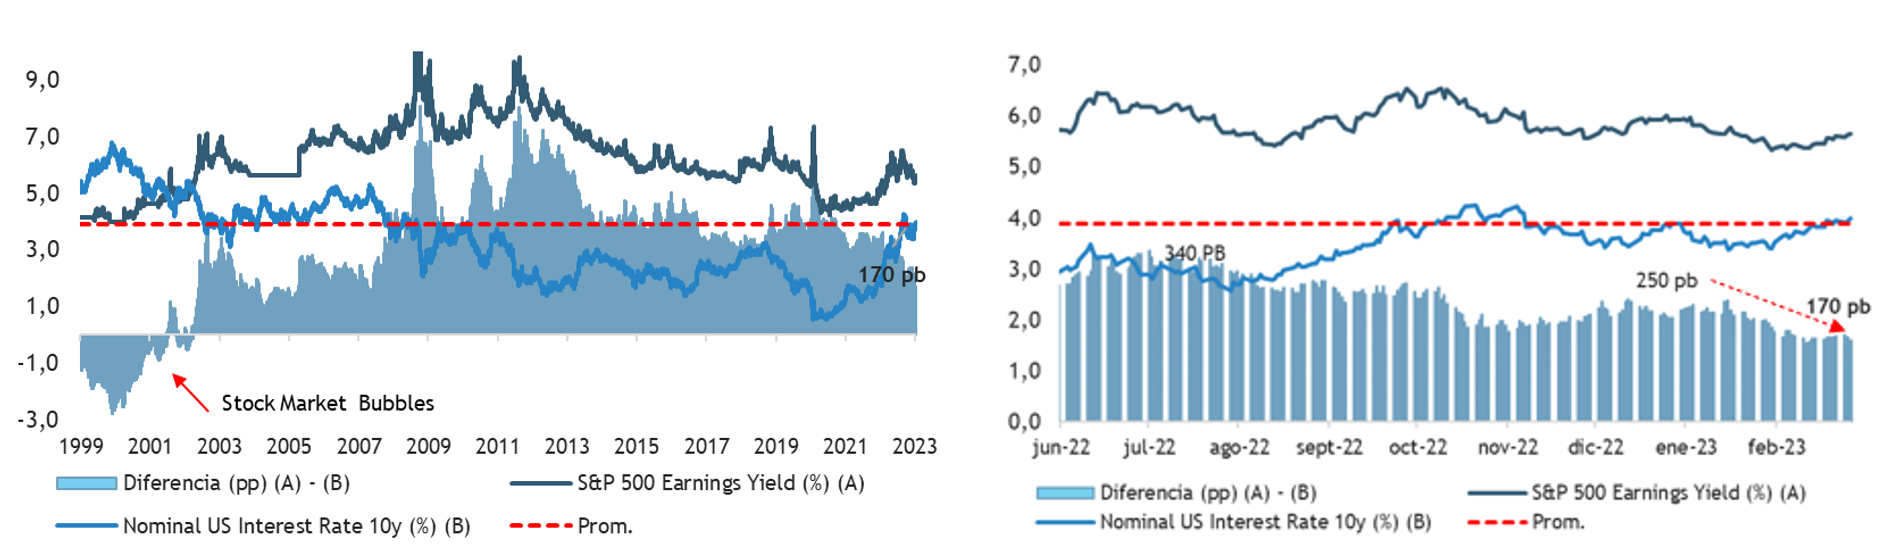
However, we believe that the divergence between equities and interest rates cannot go much further and may reverse. The risk-reward ratio of holding bonds for up to two years at the current yield level (around 5%) appears better than that of equities (earnings yield) than at any other time since the Great Financial Crisis (i.e., the spread between short-term sovereign rates and the earnings yield on stocks is at its lowest point since 2007). (See here).
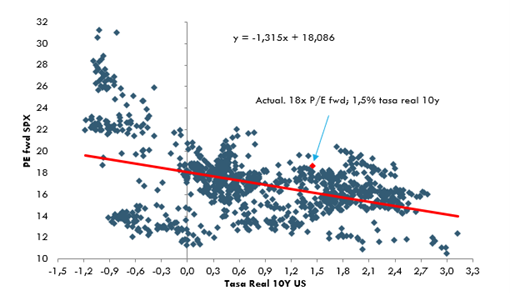
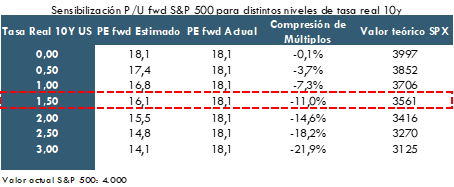
Recent economic data suggest that the tightening cycles of major developed-market central banks are likely to be extended and, more importantly, fewer adjustments or easing measures are now expected following the latest rate hike. The bond market has increasingly priced in a more aggressive scenario, but the stock market has done so to a lesser extent. Historically, at current real interest rates, the S&P 500’s multiple is overvalued by ~2.0x; that is, instead of the 18x forward P/E it currently trades at, it should be trading closer to 16x, and the discount widens if rates continue to rise—which appears to be the most likely scenario (see Chart No. 5). Furthermore, a 170-basis-point equity risk premium is not sustainable in our view, and a reversal to levels closer to 250 basis points (the average over the last 12 months) seems more reasonable to us.
Chart No. 5: S&P 500. Stock Prices vs. Interest Rates (20-Year)